Crude Thoughts: Recent Oil Price Volatility - Transient or Structural Shift?
-
Petroleum markets have experienced a dramatic price reversal over the past several weeks.
-
We believe that this move reflects an inventory imbalance driven by a confluence of short-term supply factors and seasonal demand weakness.
-
We think that it is too early to infer a longer-term reversion back to sustained inventory increases after two years of drawdowns.
In mid-September, we examined how rising oil prices had caught forecasters off guard, and we considered the medium-term outlook for price levels and volatility. Subsequently, front-month WTI crude oil prices climbed to $76 per barrel, and then fell by over $25 to $50 per barrel as of November 23. What factors have driven the selloff, and what are the implications for the longer-term outlook?
The price declines have resulted from a confluence of short- and intermediate-term fundamental and technical factors that impacted both petroleum supply and demand.
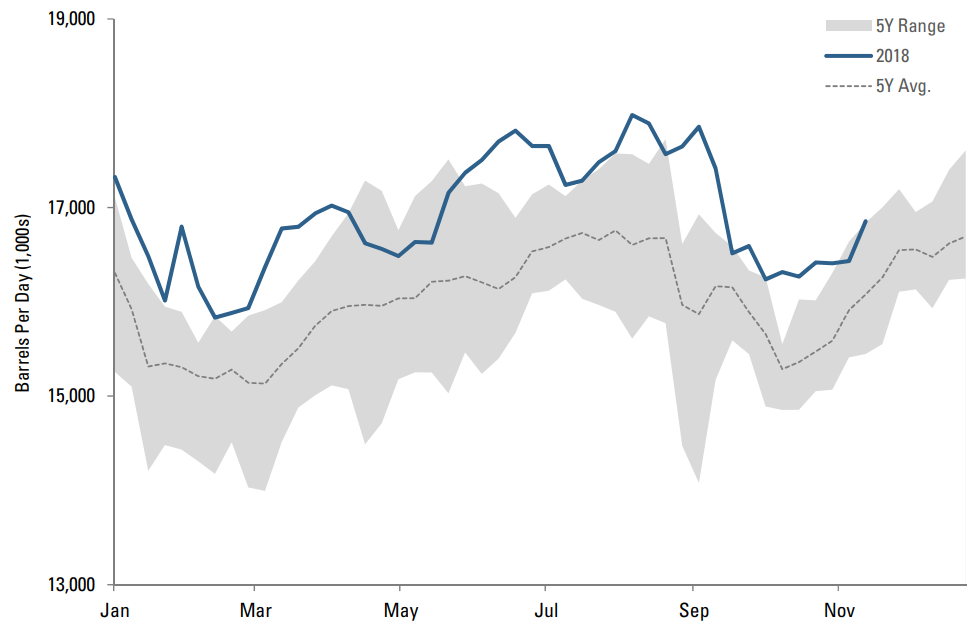
On the demand side, oil consumption tends to drop during the fall months when U.S. refiners enter peak refinery maintenance—a seasonal effect which typically reduces demand by upwards of 2 million barrels per day (mbpd), roughly 10%. This is evident in Figure 1, where we’ve overlaid year-to-date demand on the average, high, and low series from the prior five years. The chart shows how, starting in mid-August, refinery demand dipped significantly, roughly in line with the timing and magnitude of reductions in recent years during the fall season.
Figure 1: Seasonality in U.S. DOE Crude Oil Total Refinery Input
At around the same time, however, several unexpected factors increased supply. First, in August the Trump administration had ordered the release of 11 million barrels from the Emergency Strategic Petroleum Reserve (SPR) during October and November; roughly half of that hit the market by the end of October, adding supply during a low-demand period.
Second, as the Plains All American Sunrise Pipeline expansion entered service in October, 350,000 barrels per day of additional pipeline capacity came online in the Permian Basin. This allowed incrementally more low-cost U.S. shale oil to reach the market. As a consequence of this increased connectivity, the geographical spot discount between WTI trading at Midland and WTI trading at Cushing has narrowed from -$15 in early September to roughly -$7, as shown in Figure 2.
Figure 2: Crude Oil Spread: WTI Midland Spot Minus WTI Cushing Spot
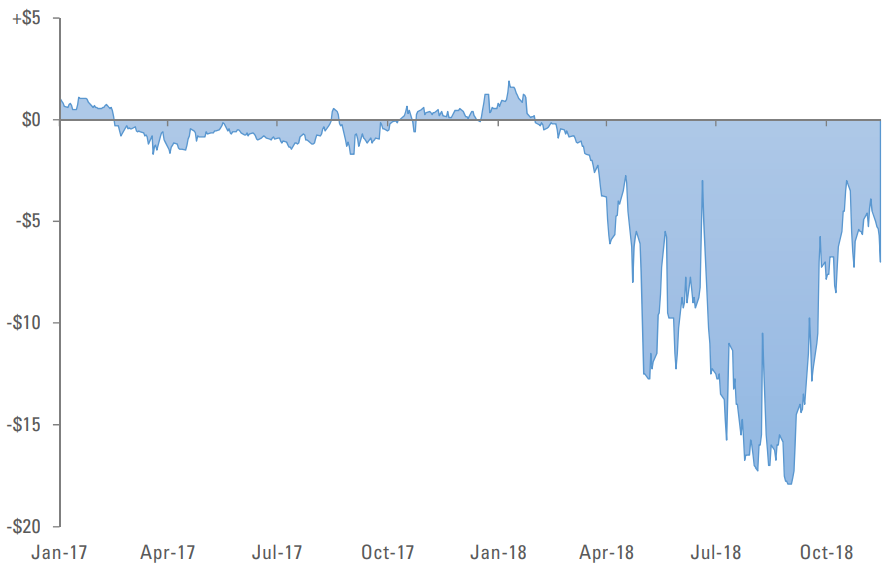
Figure 3: Total Inventory vs Five-Year Trend
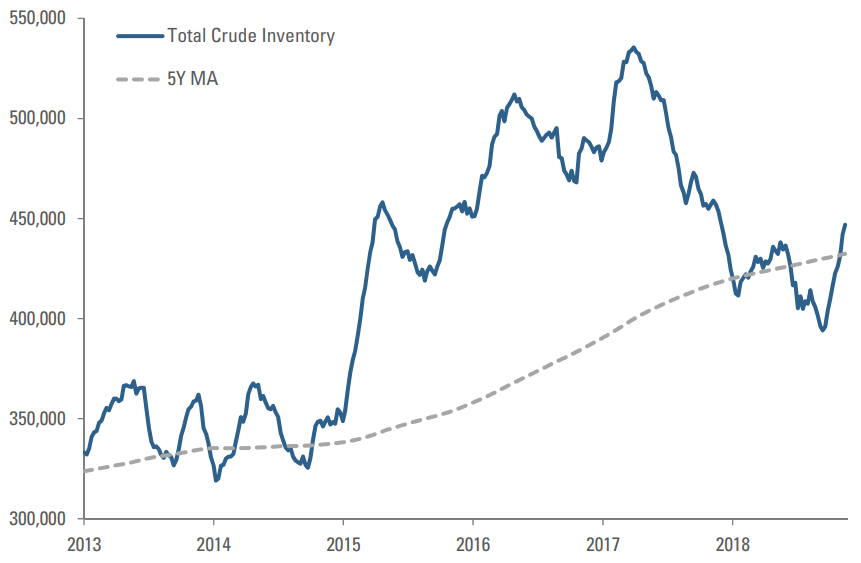
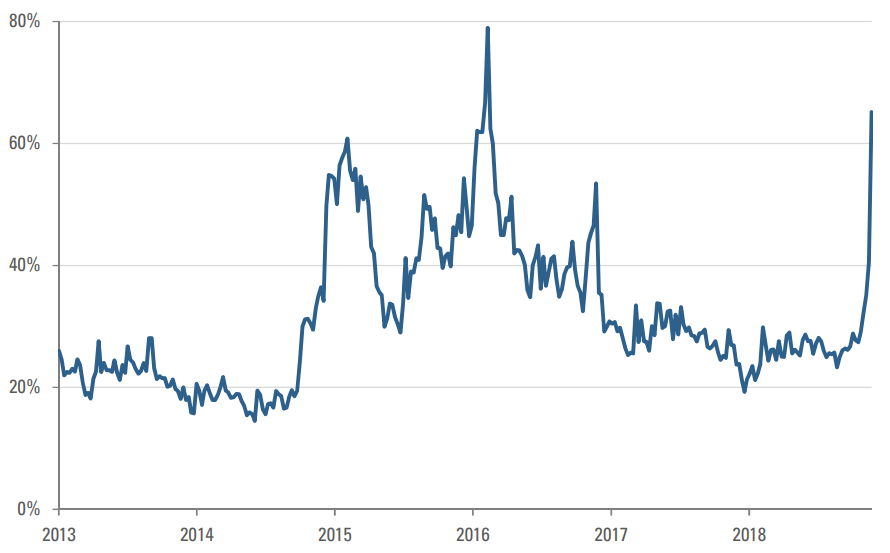
Figure 4: CBOE Crude Oil Volatility Index
Finally, following the imposition of new sanctions on Iran, the Trump administration unexpectedly granted temporary waivers for that country’s top oil consumers, in effect freeing up oil supply into the market that otherwise would have been displaced. Moreover, despite increased supply, the U.S. has continued its rhetorical pressure on OPEC not to reduce production.
The combined effect of the demand and supply shifts has caused the physical crude market to flip from deficit to meaningful seasonal surplus, pushing up inventories back to their 5-year average. (Figure 3)
Given that demand is usually weak in late-Q3 through early-Q4, we think it may be too early to infer that the physical market, after two years of deficits, is now reverting to persistent surpluses. Both the IEA and OPEC expect global demand to remain near the long-term average in 2019, following robust years in 2017 and 2018, which were marked by record refining demand and vehicle miles traveled. On the supply side, OPEC is expected to at least maintain its cut, if not to reduce supply even further, and U.S. shale infrastructure will be materially constrained until Q4 of 2019, when a large batch of pipeline projects from the Permian is expected to come online. Hence, recession risks aside, we see a seasonal resumption of inventory drawdowns in the first half of 2019, which still exceed OPEC targets.
As we concluded in September, we continue to foresee elevated oil price volatility. Consistent with that view, recent price swings and potential near-term catalysts, including the upcoming OPEC meeting and ongoing trade frictions, have caused short-dated crude implied volatility to jump back up to 2014 levels. (Figure 4) Over the longer-term, the emergence of U.S. shale alongside OPEC has made supply dynamics more complex and difficult for markets to predict. Given the potential for elevated oil price volatility, we continue to caution against blindly taking long-oil positions based solely on a long-term supply and demand balance outlook. Rather, we advocate a more flexible approach that may vary between long and short positioning informed by a more comprehensive set of inputs, incorporating short- and intermediate-term price drivers as well as sentiment and technical considerations.